



How to Read Your Metabolic Labs: A Guide for GLP-1 Patients


EllieMD
5 min read
Your metabolic labs tell the story of what GLP-1 therapy is doing beyond the scale. Here is what A1c, fasting insulin, lipid panel, and liver markers actually mean and how to track them.
Most patients on GLP-1 therapy track their progress on the scale. The scale tells part of the story. Your metabolic labs tell a different and often more important part, showing what is happening at the cellular and systemic level as the medication works. Understanding what your lab values mean, what direction you want them to move, and what they tell your physician about your health gives you a much richer picture of how your program is working.
This is a guide to the most relevant metabolic labs for GLP-1 patients, written plainly.
Hemoglobin A1c
HbA1c represents your average blood glucose level over the past two to three months, expressed as a percentage. Red blood cells carry glucose attached to hemoglobin, and A1c measures how much glucose has accumulated on those cells over their lifespan.
Normal is below 5.7 percent. Prediabetes is 5.7 to 6.4 percent. Type 2 diabetes is 6.5 percent and above.
GLP-1 therapy produces consistent improvements in A1c in people with elevated baseline values. For a patient who starts with an A1c of 6.2 percent, seeing it fall to 5.5 or 5.6 percent after several months of GLP-1 therapy represents a meaningful reduction in metabolic disease risk, not just a number changing on a lab report. A1c is one of the clearest objective indicators that the metabolic dimension of GLP-1 therapy is working.
Fasting Insulin and HOMA-IR
Fasting insulin measures how much insulin your pancreas is producing at baseline to maintain normal blood glucose. In a metabolically healthy person, fasting insulin is low because cells respond normally to modest insulin signaling.
In insulin resistance, fasting insulin is elevated because the pancreas is compensating for reduced cellular responsiveness by producing more insulin. High fasting insulin in the context of normal blood glucose is the earliest detectable marker of insulin resistance, appearing years before A1c or fasting glucose begin to rise.
HOMA-IR is a calculated index using fasting glucose and fasting insulin together that provides a more complete picture of insulin resistance. Values above approximately 2.5 to 3 suggest meaningful insulin resistance. GLP-1 therapy consistently reduces fasting insulin and HOMA-IR, reflecting the fundamental metabolic improvement the medication produces.
If your physician has not ordered fasting insulin as part of your baseline workup, asking for it gives you a more sensitive picture of your starting metabolic state and a meaningful marker to track improvement.
The Lipid Panel
A standard lipid panel measures total cholesterol, LDL cholesterol, HDL cholesterol, and triglycerides. For GLP-1 patients, triglycerides and HDL are the values most likely to show meaningful early movement.
Triglycerides are the form in which excess calories, particularly from carbohydrates and alcohol, are stored in the blood and fat tissue. They are strongly influenced by caloric intake, carbohydrate consumption, and alcohol. GLP-1 therapy produces rapid reductions in triglycerides in most patients with elevated baseline values, often within the first one to three months of treatment. Normal triglycerides are below 150 mg/dL. Values above 200 are elevated and above 500 represent a specific medical concern for pancreatitis risk.
HDL cholesterol, often called the good cholesterol, tends to improve with weight loss and increased physical activity. Low HDL is a component of metabolic syndrome and a cardiovascular risk factor.
LDL cholesterol is the primary target of statin therapy and cardiovascular risk management. GLP-1 therapy does not dramatically change LDL directly, though weight loss and dietary changes associated with the program can produce modest improvements.
Liver Enzymes
ALT and AST are enzymes that leak from liver cells when those cells are inflamed or damaged. Elevated ALT and AST indicate liver stress. For patients with non-alcoholic fatty liver disease, these values are often elevated at baseline and typically improve with GLP-1-induced weight loss and reduction in liver fat.
Tracking liver enzymes through a GLP-1 program is useful both because improvement confirms the hepatic benefits discussed in the fatty liver article, and because any unexpected worsening warrants physician evaluation.
Inflammatory Markers
CRP (C-reactive protein) and sometimes IL-6 or other cytokines are ordered in metabolic workups to assess systemic inflammation. CRP is an acute-phase protein produced by the liver in response to inflammatory signals, and chronically elevated CRP is a cardiovascular risk marker independent of cholesterol levels.
GLP-1 therapy produces consistent reductions in CRP, sometimes quite dramatically in patients with significant visceral fat and metabolic inflammation. Seeing CRP fall from elevated to normal range represents a biological change in inflammatory burden that has direct relevance to cardiovascular, metabolic, and brain health outcomes.
Making Sense of the Whole Picture
No single lab value tells the complete story. Your physician interprets these values together, in the context of your health history, your physical exam, and your symptoms. A patient with elevated A1c, high triglycerides, elevated fasting insulin, elevated liver enzymes, and high CRP is showing a metabolic syndrome picture that GLP-1 therapy addresses comprehensively. Tracking all of these markers over time gives a much richer picture of what the treatment is doing than the scale alone.
The practical takeaway is to ask your physician for a comprehensive metabolic panel at the start of your program and to review results at regular intervals during treatment. The numbers represent real biological change, and understanding what they mean helps you stay motivated and informed throughout your program.
Learn more at the EllieMD YouTube Channel.
Individual results may vary. All prescriptions require approval by a licensed medical provider. Compounded medications are not FDA-approved. EllieMD facilitates access to independent healthcare providers and pharmacies and does not provide medical care or dispense medications.
Related Articles
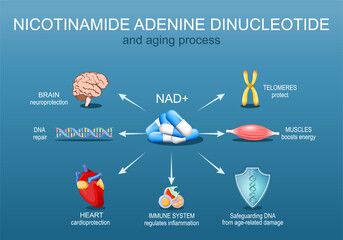
NAD+ Oral Drops with GLP-1: What the Combined Formulation Is Designed to Do
EllieMD

GLP-1 and Joint Pain: The Connection Between Weight, Inflammation, and Chronic Pain
EllieMD
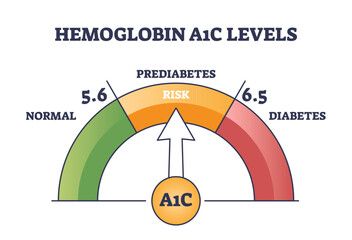
What Prediabetes Actually Means and Why GLP-1 Therapy Is Relevant
EllieMD

GLP-1 Side Effects: What to Expect and How to Manage Them
EllieMD

GLP-1 and Testosterone: What Men Need to Know About the Hormonal Connection
EllieMD

How Does GLP-1 Work in the Body? A Plain-Language Explanation
EllieMD
Get the latest updates and exclusive offers by subscribing to our newsletter.
© 2026 EllieMD LLC. All rights reserved.
